121.5 Asset Management: Difference between revisions
m →121.5.18 Intermodal Freight Connectivity: Per Organizational Results, links to reports added |
No edit summary |
||
| (32 intermediate revisions by 3 users not shown) | |||
| Line 1: | Line 1: | ||
<div style="float: right; margin-left: 30px; margin-bottom: 30px;">__TOC__</div> | |||
MoDOT’s asset management plan is a rolling 10-year strategic framework for making cost-effective decisions about allocating resources and managing road and bridge system infrastructure. It is based on a process of monitoring the physical condition of assets, predicting deterioration over time and providing information on how to invest in order to meet asset management goals. | |||
MoDOT’s Asset Management Plan (AMP) is a crucial element in achieving MoDOT’s strategic goal of keeping roads and bridges in good condition. The AMP ensures MoDOT is using taxpayer money wisely by: | |||
:* Minimizing life cycle costs, | |||
:* Maximizing system performance, | |||
:* Supporting an objective decision making process, and | |||
:* Balancing public expectations with limited funding to create a sustainable plan. | |||
'''Purpose''' | |||
MoDOT has adopted a transportation asset management approach to make the best decisions with transportation investments, by allowing decision makers to see how their investment decisions today will affect the system in the future. The purpose of the AMP is to keep roads and bridges in good condition for as long as possible given current funding levels. The plan also clearly demonstrates the investment level needed in order to maintain the system at its current condition and is a transparent way to communicate the funding needs for the system. | |||
'''Background''' | |||
MoDOT’s current asset management strategies have been in place since 2005. In 2016, MoDOT’s asset management planning evolved from a statewide plan to individual district models. Since 2016, each of MoDOT’s seven districts maintain an asset management plan for pavements and bridges. These plans have been developed and updated annually by multi-disciplinary teams including bridge, pavement, mobility and maintenance experts along with input from senior leadership, Federal Highway Administration (FHWA) and regional planning partners. | |||
'''Goals and Objectives''' | |||
The department’s asset management plan has been designed to align with MoDOT’s Tangible Results and with Missouri’s Long Range Transportation Plan (LRTP). The current and past LRTPs had extensive citizen outreach and consistently produced a number one goal of taking care of the system. Missourians continue to place the highest priorities on structurally sound bridges and smooth roads, as does the AMP. The AMP objective is keep the state’s transportation assets in a good condition over the life cycle of those assets at the most practical cost. Based on current funding constraints, the goal of the AMP is to maintain | |||
existing pavement and bridge conditions. | |||
==121.5.1 Asset Inventory and Condition== | |||
Missouri’s state highway system includes over 33,000 centerline miles of roads and more than 10,000 bridges. The system is divided into four roadway categories, each of which has its own unique characteristics regarding size, condition and use: | |||
:1) Interstates | |||
: | :2) [[media:144 Major Highway System 2022.pdf|Major routes]] | ||
:3) Minor routes | |||
:4) Low volume routes (fewer than 400 vehicles per day). | |||
===121.5.1.1 Pavements=== | |||
: | ====121.5.1.1.1 Pavements Overview==== | ||
---- | |||
<big>'''[[media:144 Major Highway System 2022.pdf|Major routes]]'''</big> in Missouri include interstate routes and other major routes and consist of over 5,500 miles and these routes carry the majority of the travel in state. All Major Routes are included in the AMP. For current condition and cost to maintain these routes see [https://epg.modot.org/forms/general_files/TP/Asset_Management_Summary.pdf Current Asset Management Plan Summary]. | |||
<gallery mode=packed heights=250px> | |||
File:major_routes-06-24_01.png | |||
File:major_routes-06-24_02.png | |||
</gallery> | |||
---- | |||
<big>'''Minor Routes'''</big> in Missouri consist of over half of the miles on state system and these routes carry approximately one-fourth of the travel in state. All Minor Routes are included in the AMP. For current condition and cost to maintain these routes see [https://epg.modot.org/forms/general_files/TP/Asset_Management_Summary.pdf Current Asset Management Plan Summary]. | |||
<gallery mode=packed heights=250px> | |||
File:minor_routes-06-24_01.png | |||
File:minor_routes-06-24_02.png | |||
</gallery> | |||
---- | |||
<big>'''Low Volume Routes'''</big> in Missouri include routes with fewer than 400 vehicles per day travelling on them. Low volume routes consist of approximately 1/3 of the miles on the state system and these routes carry a very small percentage of the travel in state. Low Volume Routes are not included in the AMP and are maintained by MoDOT Maintenance forces. For current condition and cost to maintain these routes see [https://epg.modot.org/forms/general_files/TP/Asset_Management_Summary.pdf Current Asset Management Plan Summary]. | |||
<gallery mode=packed heights=250px> | |||
File:low_vol_routes-06-24_01.png | |||
File:low_vol_routes-06-24_02.png | |||
</gallery> | |||
---- | |||
: | ====121.5.1.1.2 Pavement Data Collection and Analysis==== | ||
[[image:121.5.1.1.2 aran.jpg|350px|right]] | |||
MoDOT administers a transportation management system (TMS) to store pavement and bridge asset data, which includes a location referencing system, condition data and videos. Pavement data for all state owned routes are collected annually. MoDOT uses an Automatic Road Analyzer (ARAN) vehicle (photo below) to collect the pavement condition data and video of each route. This information is critical to managing MoDOT’s pavement and bridge assets. | |||
TMS applications capture and store all historical pavement data. MoDOT pavement experts then query this historical information and analyze the data using spreadsheets to determine how well the pavement has performed and to establish future pavement deterioration rates for pavement sections. | |||
The pavement planning tool within TMS (as shown below) has the ability to indicate pavement sections that need attention by year. These identified pavement sections are then further analyzed by MoDOT pavement engineers to determine right treatment for the condition. These pavement sections are then considered for programming in the five-year [[121.3 The Statewide Transportation Improvement Program (STIP)|Statewide Transportation Improvement Plan (STIP)]]. | |||
[[image:121.5.1.1.2 pavement.jpg|600px|center]] | |||
MoDOT has historically analyzed pavement data and tracked progress of pavement by smoothness. Smoothness is measured by international roughness index (IRI), the lower the IRI, the smoother the road. Shown below are the MoDOT rating categories for pavement smoothness: | |||
<center>'''Pavement Smoothness Condition Categories''' | |||
{| border="1" class="wikitable" style="margin: 1em auto 1em auto" style="text-align:center" | |||
{| border="1" class="wikitable" style="margin: 1em auto 1em auto" | |||
|+ | |+ | ||
! | ! style="background:#BEBEBE" |Roadway Type!! style="background:#BEBEBE" |IRI Rating Criteria for Good Condition | ||
|- | |- | ||
| | |Interstates & Other Major Routes|| <100 | ||
|- | |- | ||
| | |Minor Routes (>400 vehicles per day)|| <140<sup>1</sup> | ||
|- | |- | ||
| | |Low Volume Routes|| <170<sup>2</sup> | ||
|- | |- | ||
| | |align=left colspan=2|<sup>1</sup> Can be rated good by visual assessment for IRI <170 | ||
|- | |||
|align=left colspan=2|<sup>2</sup> Can be rated good by visual assessment for IRI <220 | |||
|} | |} | ||
</center> | |||
For current condition and cost to maintain these routes see [https://epg.modot.org/forms/general_files/TP/Asset_Management_Summary.pdf Current Asset Management Plan Summary]. | |||
For | |||
===121.5. | ===121.5.1.2 Bridges=== | ||
[[image:121.5.1.2.1.jpg|400px|right]] | |||
====121.5.1.2.1 Bridges Overview==== | |||
Missouri has over 10,000 bridges of which over 200 are classified as a Major Bridge (greater than 1,000 feet in length). All state owned bridges are included in the AMP. For current condition and cost to maintain these bridges see [https://epg.modot.org/forms/general_files/TP/Asset_Management_Summary.pdf Current Asset Management Plan Summary]. | |||
====121.5.1.2.2 Bridges Data Collection and Analysis==== | |||
[[image:121.5.1.2.2.jpg|700px|right]] | |||
All bridges are inspected regularly in accordance with federal law, typically every two years. If a bridge has known problems, it is inspected more frequently. According to the National Bridge Inspection Standards (NBIS), condition ratings are used to describe an existing bridge or culvert compared with its condition if it were new. The ratings are based on the materials, physical condition of the deck (riding surface), the superstructure (supports immediately beneath the driving surface) and the substructures (foundation and supporting posts and piers). | |||
A condition rating is assigned for the bridge’s deck, superstructure and substructure. The lowest rating of the three components is considered the bridge rating. | |||
{| border="1" class="wikitable" style="margin: 1em auto 1em auto" | The rating scale is: | ||
:'''9''' – Excellent; '''8''' – Very Good; '''7''' – Good; '''6''' – Satisfactory; '''5''' – Fair; '''3''' or '''4''' – Poor; '''2 or less''' – Closed | |||
<center> | |||
{| border="1" class="wikitable" style="margin: 1em auto 1em auto" style="text-align:center" | |||
|+ | |+ | ||
! | ! style="background:#BEBEBE" |NBIS!! style="background:#BEBEBE" |Thresholds for Bridge Condition | ||
|- | |- | ||
| | |9||rowspan=3|Good | ||
|- | |- | ||
| | |8 | ||
|- | |- | ||
| | |7 | ||
|- | |- | ||
| | |6||rowspan=2|Fair | ||
|- | |- | ||
|5 | |5 | ||
|- | |- | ||
| | |4||rowspan=2|Poor | ||
|- | |||
|3 | |||
|} | |} | ||
</center> | |||
The bridge TMS applications with the bridge NBIS data gathered from field inspections make up the Bridge Management System (BMS). MoDOT has collected and maintained inventory and condition information on National Bridge Inventory (NBI) structures since 1971. An NBI structure is defined as a bridge or culvert that has an opening of at least 20 feet along the centerline of the roadway, is open to the public, and carries vehicular traffic as per 23 CFR 650. | |||
The vast majority of bridges in Missouri are inspected by MoDOT personnel with a small number inspected by consultants or by the local bridge owner. Most are inspected on a two year frequency while a few are done more frequently. MoDOT has worked with FHWA to develop criteria for inspecting some lower risk structures on a 48-month frequency. This is a tool available to MoDOT District Bridge Engineers to help reduce the bridge inspection workload. | |||
Historically, a 50-year service life was anticipated for bridges; however, starting in 2010, structures are anticipated to have a 75-year service life. Major bridges designed since 2000 are anticipated to have a 100-year service life. One of the challenges with managing the bridge assets is the wave of bridges built in the 1950s and 1960s that are all reaching the end of their service life at about the same time. | |||
When programming bridge work, MoDOT takes a multi-pronged approach with varying work types. With the amount of poor bridges in Missouri, several replacements or redecks are needed per year; however, it is more cost effective to spend a portion of the limited funds on keeping Fair bridges Fair and Good bridges Good. This is done through a combination of rehabilitations and preventive maintenance projects. The expected life is 7 to 20 years for bridge rehabilitation. | |||
==121.5.2 Asset Management Policy Guidelines== | |||
===121.5. | ===121.5.2.1 MoDOT’s Asset Management Statewide Goals=== | ||
:* Keep Major Routes in at least 90% good condition. This target goal is reflected in the MoDOT Tracker Measure 2a. | |||
:* Keep Minors Routes (greater than 400 vehicles per day) in at least 80% good condition. This target goal is reflected in the MoDOT Tracker Measure 2a. | |||
:* Keep Low Volume Routes (Minors Routes with fewer than 400 vehicles per day) in at least 70% good condition. This target goal is reflected in the MoDOT Tracker Measure 2a. These routes are not included in the AMP. They are maintained by MoDOT Maintenance forces and the plan for these routes is managed by [https://modotgov.sharepoint.com/sites/mt Central Office Maintenance Division] and MoDOT districts. | |||
:* Bridges – maintain the square foot bridge deck in the poor condition from 2016. The square foot of bridge deck in poor condition in 2016 was 4,925,371, which equates to approximately 900 bridges as represented in MoDOT Tracker Measure 2b. | |||
<center> | |||
{| border="1" class="wikitable" style="margin: 1em auto 1em auto" style="text-align:center" | |||
{| border="1" class="wikitable" style="margin: 1em auto 1em auto" | |||
|+ | |+ | ||
! | ! style="background:#BEBEBE" |Asset Category!! style="background:#BEBEBE" |Asset Management Statewide Goal | ||
|- | |- | ||
| | |Major Routes – Pavements ||90% Good | ||
|- | |- | ||
| | |Minor Routes (>400 vehicles per day) – Pavements ||80% Good | ||
|- | |- | ||
| | |Low Volume Routes (<400 vehicles per day) - Pavements ||70% Good | ||
|- | |- | ||
| | |Bridges – Poor condition by square feet ||<4,925,371 square feet | ||
|- | |- | ||
| | |Bridges – Poor condition by number ||<900 bridges | ||
|} | |} | ||
</center> | |||
The district asset management plan should serve as a <u>guide</u> when programming projects into the five-year STIP. For example, the asset management plan might indicate 100 miles of interstate be treated each year, but it does not indicated which 100 miles need treated in that particular year. However, 100 miles should be the target to hit when programming miles to be treated on the interstate in the STIP. The same concept is used for bridges, the asset management plan is a guide to help program the right amount of bridge work to keep the system in good condition. | |||
===121.5.2.2 Pavements=== | |||
:* Overall strategy is to keep good roads in good condition using thin, lower cost preventative maintenance treatments before road conditions worsen and require more costly treatments. | |||
:* Pavement reconstruction will be limited. | |||
:* Shoulder work should be limited and only used as necessary rather than routine. | |||
:* Districts will determine the treatment type, life expectancy and cost/mile for the district specific models and document in their plan how the data was determined. | |||
:* The cost/mile will reflect <u>total project cost</u>/mile not solely pavement cost/lane mile. Total project costs could include items such as: guardrail, grading, coldmilling, mobilization, striping, rumbles, shoulders, traffic control, pavement repair, ADA etc. | |||
===121.5. | ===121.5.2.3 Bridges=== | ||
== | :* Overall strategy is to keep bridges in good condition by maintaining the square foot of bridge deck that is considered poor to the level that was realized in 2016. To accomplish this, MoDOT is using a two-pronged approach. First, fair and good condition bridges must be addressed with preventative maintenance treatments. Second, poor condition bridges will be replaced/redecked. | ||
:* Each district will work with [https://modotgov.sharepoint.com/sites/br Central Office Bridge Division] to establish the replacement/redeck/other (PM/rehab) goals specific to that district and based upon the condition of bridges in that particular district. | |||
:* The cost/sqft will reflect <u>total project cost</u>/sqft not solely bridge cost/sqft. Total project costs could include: roadway pavement costs, mobilization, striping, guardrail, traffic control etc. | |||
:* Major Bridges (1000 feet or longer), are on a planned schedule for replacement/rehab. The [https://modotgov.sharepoint.com/sites/br/_layouts/15/Doc.aspx?sourcedoc=%7B7C8C1A0D-A3E5-4AD0-A091-01E3498EBB97%7D&file=Major%20Bridge%20Asset%20Management%20Information.xlsx&action=default&mobileredirect=true&DefaultItemOpen=1 Major Bridge Asset Management Plan] must be reviewed by the district and if changes need to be made to the cost, type of work and/or year of construction, contact Central Office Bridge Division as they maintain the master file. | |||
:* District Maintenance will continue to perform regular preventative maintenance activities, including bridge flushing and deck sealing. | |||
===121.5.2.4 ADA=== | |||
:* Transition plan must be completed by 2027. Each district outlines the cost to complete the plan and shows how they plan to program the remaining amount. | |||
:* For most districts, it will take more funds than what is received from the Transportation Alternative funds to pay for the rest of the transition plan work. | |||
:* Standalone ADA projects can be accounted for in the Asset Management Plan or ADA can be included in pavement projects. | |||
===121.5.2.5 General Programming based on Asset Management=== | |||
:* Each district’s funding will continue to be based on the Missouri Highways and Transportation Commission’s Funding Distribution Policy. All districts distributed funds are accounted for in the Asset Management plans including Safety and Open Container Funds. | |||
:* The concept of practical design still serves as the expectation for project development. | |||
:* The use of core teams is essential in the project development process. Not all improvements desired by the team members make the scope that ultimately gets programmed. The project manager’s responsibility is to develop a project that meets the purpose and need. | |||
:* Scoping and Programming – Having a project fully scoped and designed up to preliminary plans is necessary to set the initial project programming budget. After being programmed, the project budget growth is limited to 3% per year. | |||
===121.5.2.6 What Does the Asset Management Plan (AMP) Tell Me?=== | |||
:* The AMP is based on a 10-year window and it indicates if the district has any funds leftover after taking care of bridges and pavements in the AMP. | |||
:* If a district has any leftover funds, i.e. the district can meet their AMP goals, then system improvement projects can be programmed. | |||
:* If a district does not have any leftover funds i.e. the district cannot meet their AMP goals, then tradeoff discussions must take place within the district and planning partners. Priority will be given to the interstate and major routes (NHS) as the FAST Act emphasizes maintaining these routes. | |||
: | For current conditions, costs to maintain the system, work types, life cycles etc., see [https://epg.modot.org/forms/general_files/TP/Asset_Management_Summary.pdf Current Asset Management Plan Summary]. | ||
==121.5.3 Lifecycle Planning & Preventive Maintenance== | |||
Ideally, every mile of pavement and every bridge in the state would be in good condition. Unfortunately, funding is not available to improve and maintain Missouri’s entire transportation system in good condition, so priorities must be established. Significant investments have been made to improve pavement and bridge conditions over the last decade. | |||
: | [[image:121.5.3 satisfaction.jpg|center|650px]] | ||
A previous significant investment known as The Smooth Roads Initiative (SRI) improved 2,200 miles of Missouri’s most heavily traveled roads. This program was completed in late 2006 and was mostly comprised of very thin resurfacing treatments to improve the smoothness of the pavement. Missouri’s Major Route system went from approximately 45 percent good pavements to 85 percent good pavements with this initiative and other strategic investments. The goal is to maintain these improved smooth surfaces. As you can see from the chart above, when road smoothness increases on major routes, so does customer satisfaction. | |||
The underlying goal of MoDOT’s asset management plan is to maintain the current condition of pavements and bridges. The most cost effective method to preserve pavements and bridges is to use preventive maintenance treatments while the assets are still in good/fair condition. The chart below shows the basic strategy for MoDOT’s AMP – focused on less expensive preservation treatments more often than expensive rehabilitation and reconstruction treatments less often. The objective is to slow down the rate of deterioration and provide a smooth, durable and safe roadway for users at the lowest cost. | |||
[[image:121.5.3 lifecycle.jpg|center|375px]] | |||
Lifecycle planning should not be confused with life cycle cost analysis (LCCA). LCCA is performed at the project level and compares specific treatment options against each other, for example, concrete vs. asphalt on a pavement project. Lifecycle planning is performed at the network level where the needs of all roads and structures within that particular network are considered. | |||
===121.5.3.1 Pavements=== | |||
Keeping good roads in good condition is the basic premise of MoDOT’s AMP. The pavement treatment costs for this approach are slightly different for interstates vs. major routes vs. minor routes. Predicting the future costs to keep roadways in good condition involves estimating the type of treatment work needed for each roadway category, when those treatments will be needed and how long those treatments will be effective. The effective life of pavement is most commonly impacted by the traffic volume, preventive maintenance activities, ground support and quality of the materials used in the pavement. For example, interstate routes require a more expensive, heavy-duty pavement to withstand higher traffic volumes and truck traffic. | |||
a. | MoDOT’s approach to pavement preservation is applying a thin, preventive maintenance treatment on a routine cycle. This is the most cost effective way to keep the roads in good condition for the traveling public and preserve the investments made over the last decade. In rare instances, pavements will need a full depth replacement, but properly designed and maintained pavements should only require a preventive maintenance treatment to extend its full life. In addition to the cyclical preventive maintenance treatments, other preventive maintenance treatments such as crack sealing and pavement repairs are performed to further extend the pavements useful life. | ||
For the treatment assumptions, treatment life and average cost for interstate and major routes see [https://epg.modot.org/forms/general_files/TP/Asset_Management_Summary.pdf Current Asset Management Plan Summary]. | |||
===121.5.3.2 Bridges=== | |||
Since Missouri has a large number of poor condition bridges, a preventive maintenance approach alone will not be sufficient to maintain current conditions. A combination of a preventive maintenance approach to prolong the useful life of Missouri’s existing bridges and an aggressive bridge repair/replacement program is needed to maintain current bridge conditions. | |||
===121.5. | ====121.5.3.2.1 Bridge Preventive Maintenance==== | ||
MoDOT also performs preventive maintenance activities for bridges. These activities are crucial to providing the lowest lifecycle costs and include: | |||
:* Bridge cleaning and flushing to remove dirt and debris and to allow proper drainage and drying of the deck. The dirt and debris holds moisture and chlorides that cause deterioration. Deck flushing is done in the fall and spring with a thorough cleaning of entire bridge done in the spring following snow season and again in the fall prior to snow season. This cleaning includes the bridge deck, piers, abutments and lower chords of truss bridges. The goal is to flush all bridges each year. | |||
:* Bridge joint and deck sealing is done to prevent dirt, debris and chlorides from deteriorating the deck and supporting bridge members. Sealing activities are performed on a cyclic basis as well as condition basis. | |||
:* Spot painting of bearings and pilings is done to protect from rusting and is performed on an as-needed basis. | |||
====121.5.3.2.2 Typical Bridges (shorter than 1000 feet) – Bridge Work Type==== | |||
MoDOT will do a combination of replacements, redecks, rehabilitation and preventive maintenance treatments to maintain current conditions. Bridge work varies in price per bridge and type of work being performed. For the treatment assumptions, treatment life and average cost for work types see [https://epg.modot.org/forms/general_files/TP/Asset_Management_Summary.pdf Current Asset Management Plan Summary]. | |||
===121.5. | |||
Historically, MoDOT has approached bridge work by the “worst first” method. Asset management has changed the focus from a “worst first” approach to a multi-focused approach including not only full replacements of poor bridges, but also on preventive maintenance of fair condition bridges. The preventive maintenance can be rehabilitation work or traditional type preventive maintenance such as flushing. The focus on preventive maintenance allows MoDOT to keep more bridges in a fair condition much longer. | |||
====121.5.3.2.3 Major Bridges (1000 feet or longer) – Bridge Work Type==== | |||
A major bridge is greater than 1,000 feet in length. The concept of preventive maintenance to maintain current condition is also used on the major bridges in Missouri. Unfortunately, several of the major bridges in Missouri are also well over their useful life and are in need of a full costly replacement. MoDOT currently has over 200 major bridges with approximately 11 percent categorized as poor condition and are in need of replacement, and 63 percent are in the fair condition category. | |||
== | ==121.5.4 Funding Assets== | ||
{| | The Missouri Highways and Transportation Commission uses a formula to distribute construction program funds for road and bridge improvements to each of its districts. This is the largest area of MoDOT’s budget that provides funding for safety improvements, asset management and system improvement funds that districts can use to take care of the system or invest in major projects that improve safety, relieve congestion and spur economic growth. | ||
{| style="margin: 1em auto 1em auto" | |||
|- | |- | ||
| | |[[image:121.5.4.pdf|right|475px]] | ||
|- | |- | ||
|align=center|'''Construction Program Funds Distribution''' | |||
|} | |} | ||
Once construction program funds are distributed to districts, MoDOT collaborates with regional planning groups to identify local priorities based on projected available funding. The regional transportation improvement plans are brought together to form the department’s STIP, which outlines five years of transportation improvements. As one year of the plan is accomplished, another year is added. | |||
Beginning in Fiscal Year 2022, the Asset Management category allocation amount is based on needs identified in MoDOT’s Asset Management Plan and will be reviewed and updated, if necessary, annually. These amounts will include inflation consistent with MoDOT’s Asset Management Plan. The allocation is distributed as follows: | |||
The | |||
:* Major Bridges (1000 feet or longer) | |||
:* Asset Management – Remaining asset management total distributed based on formulas that average: | |||
::• Percent of total Vehicles Miles Traveled (VMT) on the National Highway System and remaining arterials. | |||
::• Percent of square feet of typical state bridge deck (shorter than 1000 feet) on the total state system. | |||
::• Percent of total lane miles of National Highway System and remaining arterials. | |||
Beginning in Fiscal Year 2022 and every year thereafter, the remaining funds, System Improvements, must be first used to meet asset management goals, and then remaining funds may be used for other priorities. | |||
Distribution based on the average of: | |||
:* Percent of total population. | |||
:* Percent of total employment. | |||
:* Percent of total VMT on the National Highway System and remaining arterials. | |||
<div style="float: right"> | |||
| | {|style="padding: 0.3em; margin-left:9px; border:2px solid #a9a9a9; text-align:center; font-size: 95%; background:#f5f5f5" width="210px" align="right" | ||
|- | |- | ||
| | |'''Additional Information<br/>about Bridge Costs''' | ||
|- | |- | ||
| | |[[media:121.5.5 needs 2021.pdf|10-Year Major Bridge Needs, 2021]] | ||
|} | |} | ||
</div> | |||
Major Bridges are funded under the Asset Management funding category as shown above. Each year the Major Bridge asset management information found in the [[media:121.5.5 needs 2021.pdf|10-year Major Bridge Needs]] will be reviewed and updated by MoDOT districts and Central Office Bridge Division. If the bridge work falls within the first 3 years of the 5-year STIP, the year and dollar amounts need to be very accurate. The scope of work for Major Bridges needs to be detailed showing all the work items beyond the bridge work such as: adding lanes, expanded shoulder width, lighting, ADA accommodations, aesthetics, etc. All items of work beyond the scope of the bridge itself require the approval of the Chief Engineer to use Major Bridge asset management funds. Roadway tie-ins and traffic control will be considered part of the cost of the bridge and funded from the asset management category, however significant roadway work is not considered part of the Major Bridge and will require the approval of the Chief Engineer to use Major Bridge asset management funds. Any overruns in the project budget for scope considered beyond the Major Bridge work must be funded by the district, all underruns in the project budget will be allocated by the established funding distribution with the exception of funds from other sources that may be allocated by a pro rata share with the approval of the Chief Engineer. | |||
==121.5.5 Asset Management Updates== | |||
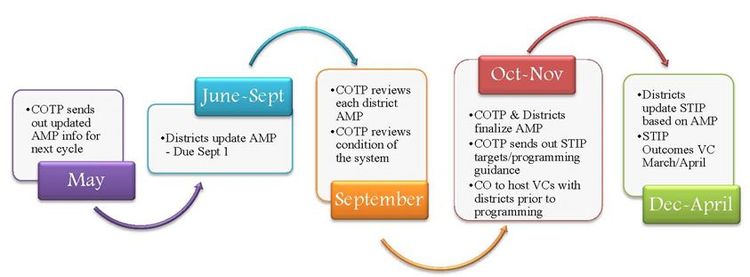
The Asset Management Plan (AMP) is a 10-year rolling plan. Each year every MoDOT district will update the AMP assumptions including: pavement cost per mile, bridge cost per square foot, treatment type, treatment life, number of miles and/or bridges being treated to align with the most current data for the region. The [https://epg.modot.org/forms/general_files/TP/Asset_Management_Summary.pdf Current Asset Management Plan Summary] document is updated yearly to reflect the statewide overall totals and assumptions that are included in the AMP. Below is the rolling timeline associated with producing yearly updates to the AMP. | |||
[[image:121.5.5.jpg|center|750px]] | |||
<center>'''Asset Management Rolling Timeline'''</center> | |||
[https://modotgov.sharepoint.com/sites/tp Central Office Transportation Planning Division] houses numerous documents and information for the asset management plan and can be found on the Transportation Planning Division’s Sharepoint site. This information is important when preparing the district’s annual AMP update or to simply refer to in the program delivery process. The documents located on the Sharepoint site are (but not limited to): Instructions to districts for updating their yearly plan, contact information, AMP timeline, historic pavement and bridge data, and each district’s specific asset management plan. | |||
[[Category:121 Project Planning, Prioritization and STIP Commitments |121.05]] | [[Category:121 Project Planning, Prioritization and STIP Commitments |121.05]] | ||
Latest revision as of 08:24, 28 June 2024
MoDOT’s asset management plan is a rolling 10-year strategic framework for making cost-effective decisions about allocating resources and managing road and bridge system infrastructure. It is based on a process of monitoring the physical condition of assets, predicting deterioration over time and providing information on how to invest in order to meet asset management goals.
MoDOT’s Asset Management Plan (AMP) is a crucial element in achieving MoDOT’s strategic goal of keeping roads and bridges in good condition. The AMP ensures MoDOT is using taxpayer money wisely by:
- Minimizing life cycle costs,
- Maximizing system performance,
- Supporting an objective decision making process, and
- Balancing public expectations with limited funding to create a sustainable plan.
Purpose
MoDOT has adopted a transportation asset management approach to make the best decisions with transportation investments, by allowing decision makers to see how their investment decisions today will affect the system in the future. The purpose of the AMP is to keep roads and bridges in good condition for as long as possible given current funding levels. The plan also clearly demonstrates the investment level needed in order to maintain the system at its current condition and is a transparent way to communicate the funding needs for the system.
Background
MoDOT’s current asset management strategies have been in place since 2005. In 2016, MoDOT’s asset management planning evolved from a statewide plan to individual district models. Since 2016, each of MoDOT’s seven districts maintain an asset management plan for pavements and bridges. These plans have been developed and updated annually by multi-disciplinary teams including bridge, pavement, mobility and maintenance experts along with input from senior leadership, Federal Highway Administration (FHWA) and regional planning partners.
Goals and Objectives
The department’s asset management plan has been designed to align with MoDOT’s Tangible Results and with Missouri’s Long Range Transportation Plan (LRTP). The current and past LRTPs had extensive citizen outreach and consistently produced a number one goal of taking care of the system. Missourians continue to place the highest priorities on structurally sound bridges and smooth roads, as does the AMP. The AMP objective is keep the state’s transportation assets in a good condition over the life cycle of those assets at the most practical cost. Based on current funding constraints, the goal of the AMP is to maintain existing pavement and bridge conditions.
121.5.1 Asset Inventory and Condition
Missouri’s state highway system includes over 33,000 centerline miles of roads and more than 10,000 bridges. The system is divided into four roadway categories, each of which has its own unique characteristics regarding size, condition and use:
- 1) Interstates
- 2) Major routes
- 3) Minor routes
- 4) Low volume routes (fewer than 400 vehicles per day).
121.5.1.1 Pavements
121.5.1.1.1 Pavements Overview
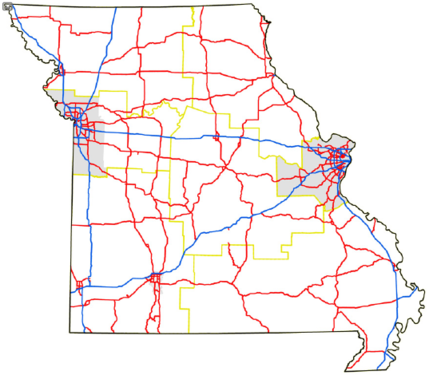
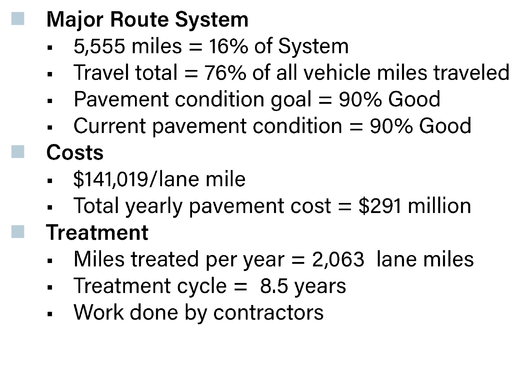
Major routes in Missouri include interstate routes and other major routes and consist of over 5,500 miles and these routes carry the majority of the travel in state. All Major Routes are included in the AMP. For current condition and cost to maintain these routes see Current Asset Management Plan Summary.
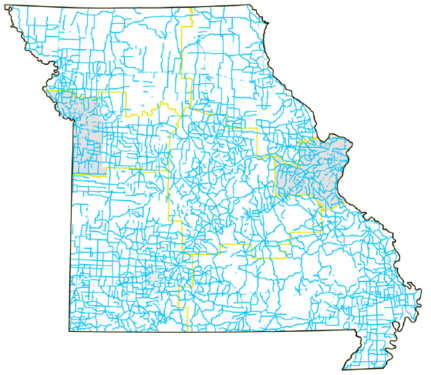
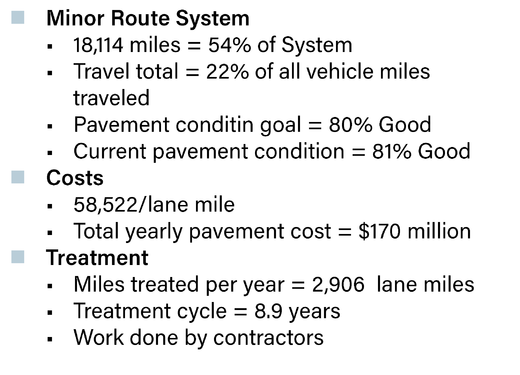
Minor Routes in Missouri consist of over half of the miles on state system and these routes carry approximately one-fourth of the travel in state. All Minor Routes are included in the AMP. For current condition and cost to maintain these routes see Current Asset Management Plan Summary.
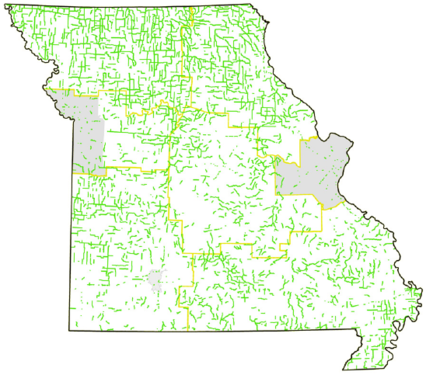
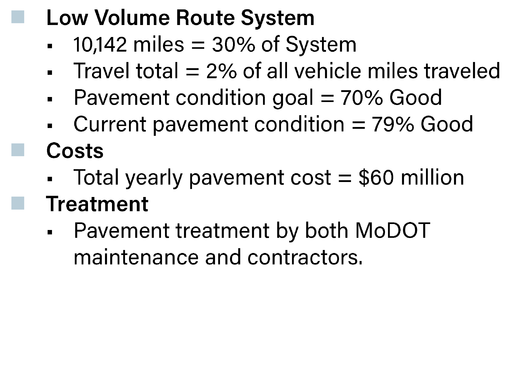
Low Volume Routes in Missouri include routes with fewer than 400 vehicles per day travelling on them. Low volume routes consist of approximately 1/3 of the miles on the state system and these routes carry a very small percentage of the travel in state. Low Volume Routes are not included in the AMP and are maintained by MoDOT Maintenance forces. For current condition and cost to maintain these routes see Current Asset Management Plan Summary.
121.5.1.1.2 Pavement Data Collection and Analysis

MoDOT administers a transportation management system (TMS) to store pavement and bridge asset data, which includes a location referencing system, condition data and videos. Pavement data for all state owned routes are collected annually. MoDOT uses an Automatic Road Analyzer (ARAN) vehicle (photo below) to collect the pavement condition data and video of each route. This information is critical to managing MoDOT’s pavement and bridge assets.
TMS applications capture and store all historical pavement data. MoDOT pavement experts then query this historical information and analyze the data using spreadsheets to determine how well the pavement has performed and to establish future pavement deterioration rates for pavement sections.
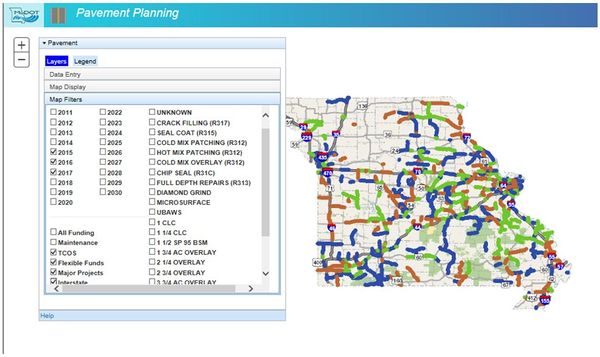
The pavement planning tool within TMS (as shown below) has the ability to indicate pavement sections that need attention by year. These identified pavement sections are then further analyzed by MoDOT pavement engineers to determine right treatment for the condition. These pavement sections are then considered for programming in the five-year Statewide Transportation Improvement Plan (STIP).
MoDOT has historically analyzed pavement data and tracked progress of pavement by smoothness. Smoothness is measured by international roughness index (IRI), the lower the IRI, the smoother the road. Shown below are the MoDOT rating categories for pavement smoothness:
| Roadway Type | IRI Rating Criteria for Good Condition |
|---|---|
| Interstates & Other Major Routes | <100 |
| Minor Routes (>400 vehicles per day) | <1401 |
| Low Volume Routes | <1702 |
| 1 Can be rated good by visual assessment for IRI <170 | |
| 2 Can be rated good by visual assessment for IRI <220 | |
For current condition and cost to maintain these routes see Current Asset Management Plan Summary.
121.5.1.2 Bridges
121.5.1.2.1 Bridges Overview
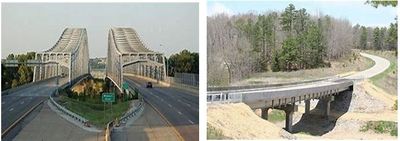
Missouri has over 10,000 bridges of which over 200 are classified as a Major Bridge (greater than 1,000 feet in length). All state owned bridges are included in the AMP. For current condition and cost to maintain these bridges see Current Asset Management Plan Summary.
121.5.1.2.2 Bridges Data Collection and Analysis
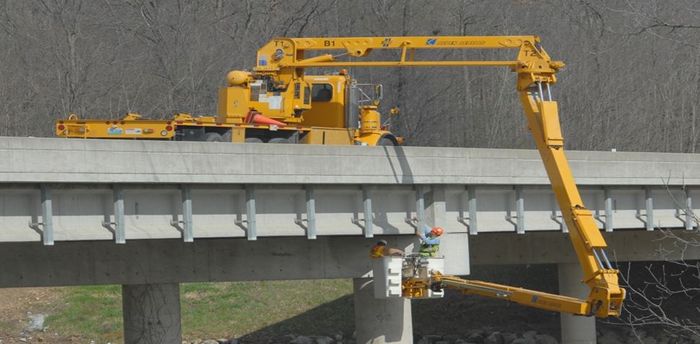
All bridges are inspected regularly in accordance with federal law, typically every two years. If a bridge has known problems, it is inspected more frequently. According to the National Bridge Inspection Standards (NBIS), condition ratings are used to describe an existing bridge or culvert compared with its condition if it were new. The ratings are based on the materials, physical condition of the deck (riding surface), the superstructure (supports immediately beneath the driving surface) and the substructures (foundation and supporting posts and piers).
A condition rating is assigned for the bridge’s deck, superstructure and substructure. The lowest rating of the three components is considered the bridge rating.
The rating scale is:
- 9 – Excellent; 8 – Very Good; 7 – Good; 6 – Satisfactory; 5 – Fair; 3 or 4 – Poor; 2 or less – Closed
| NBIS | Thresholds for Bridge Condition |
|---|---|
| 9 | Good |
| 8 | |
| 7 | |
| 6 | Fair |
| 5 | |
| 4 | Poor |
| 3 |
The bridge TMS applications with the bridge NBIS data gathered from field inspections make up the Bridge Management System (BMS). MoDOT has collected and maintained inventory and condition information on National Bridge Inventory (NBI) structures since 1971. An NBI structure is defined as a bridge or culvert that has an opening of at least 20 feet along the centerline of the roadway, is open to the public, and carries vehicular traffic as per 23 CFR 650.
The vast majority of bridges in Missouri are inspected by MoDOT personnel with a small number inspected by consultants or by the local bridge owner. Most are inspected on a two year frequency while a few are done more frequently. MoDOT has worked with FHWA to develop criteria for inspecting some lower risk structures on a 48-month frequency. This is a tool available to MoDOT District Bridge Engineers to help reduce the bridge inspection workload.
Historically, a 50-year service life was anticipated for bridges; however, starting in 2010, structures are anticipated to have a 75-year service life. Major bridges designed since 2000 are anticipated to have a 100-year service life. One of the challenges with managing the bridge assets is the wave of bridges built in the 1950s and 1960s that are all reaching the end of their service life at about the same time.
When programming bridge work, MoDOT takes a multi-pronged approach with varying work types. With the amount of poor bridges in Missouri, several replacements or redecks are needed per year; however, it is more cost effective to spend a portion of the limited funds on keeping Fair bridges Fair and Good bridges Good. This is done through a combination of rehabilitations and preventive maintenance projects. The expected life is 7 to 20 years for bridge rehabilitation.
121.5.2 Asset Management Policy Guidelines
121.5.2.1 MoDOT’s Asset Management Statewide Goals
- Keep Major Routes in at least 90% good condition. This target goal is reflected in the MoDOT Tracker Measure 2a.
- Keep Minors Routes (greater than 400 vehicles per day) in at least 80% good condition. This target goal is reflected in the MoDOT Tracker Measure 2a.
- Keep Low Volume Routes (Minors Routes with fewer than 400 vehicles per day) in at least 70% good condition. This target goal is reflected in the MoDOT Tracker Measure 2a. These routes are not included in the AMP. They are maintained by MoDOT Maintenance forces and the plan for these routes is managed by Central Office Maintenance Division and MoDOT districts.
- Bridges – maintain the square foot bridge deck in the poor condition from 2016. The square foot of bridge deck in poor condition in 2016 was 4,925,371, which equates to approximately 900 bridges as represented in MoDOT Tracker Measure 2b.
| Asset Category | Asset Management Statewide Goal |
|---|---|
| Major Routes – Pavements | 90% Good |
| Minor Routes (>400 vehicles per day) – Pavements | 80% Good |
| Low Volume Routes (<400 vehicles per day) - Pavements | 70% Good |
| Bridges – Poor condition by square feet | <4,925,371 square feet |
| Bridges – Poor condition by number | <900 bridges |
The district asset management plan should serve as a guide when programming projects into the five-year STIP. For example, the asset management plan might indicate 100 miles of interstate be treated each year, but it does not indicated which 100 miles need treated in that particular year. However, 100 miles should be the target to hit when programming miles to be treated on the interstate in the STIP. The same concept is used for bridges, the asset management plan is a guide to help program the right amount of bridge work to keep the system in good condition.
121.5.2.2 Pavements
- Overall strategy is to keep good roads in good condition using thin, lower cost preventative maintenance treatments before road conditions worsen and require more costly treatments.
- Pavement reconstruction will be limited.
- Shoulder work should be limited and only used as necessary rather than routine.
- Districts will determine the treatment type, life expectancy and cost/mile for the district specific models and document in their plan how the data was determined.
- The cost/mile will reflect total project cost/mile not solely pavement cost/lane mile. Total project costs could include items such as: guardrail, grading, coldmilling, mobilization, striping, rumbles, shoulders, traffic control, pavement repair, ADA etc.
121.5.2.3 Bridges
- Overall strategy is to keep bridges in good condition by maintaining the square foot of bridge deck that is considered poor to the level that was realized in 2016. To accomplish this, MoDOT is using a two-pronged approach. First, fair and good condition bridges must be addressed with preventative maintenance treatments. Second, poor condition bridges will be replaced/redecked.
- Each district will work with Central Office Bridge Division to establish the replacement/redeck/other (PM/rehab) goals specific to that district and based upon the condition of bridges in that particular district.
- The cost/sqft will reflect total project cost/sqft not solely bridge cost/sqft. Total project costs could include: roadway pavement costs, mobilization, striping, guardrail, traffic control etc.
- Major Bridges (1000 feet or longer), are on a planned schedule for replacement/rehab. The Major Bridge Asset Management Plan must be reviewed by the district and if changes need to be made to the cost, type of work and/or year of construction, contact Central Office Bridge Division as they maintain the master file.
- District Maintenance will continue to perform regular preventative maintenance activities, including bridge flushing and deck sealing.
121.5.2.4 ADA
- Transition plan must be completed by 2027. Each district outlines the cost to complete the plan and shows how they plan to program the remaining amount.
- For most districts, it will take more funds than what is received from the Transportation Alternative funds to pay for the rest of the transition plan work.
- Standalone ADA projects can be accounted for in the Asset Management Plan or ADA can be included in pavement projects.
121.5.2.5 General Programming based on Asset Management
- Each district’s funding will continue to be based on the Missouri Highways and Transportation Commission’s Funding Distribution Policy. All districts distributed funds are accounted for in the Asset Management plans including Safety and Open Container Funds.
- The concept of practical design still serves as the expectation for project development.
- The use of core teams is essential in the project development process. Not all improvements desired by the team members make the scope that ultimately gets programmed. The project manager’s responsibility is to develop a project that meets the purpose and need.
- Scoping and Programming – Having a project fully scoped and designed up to preliminary plans is necessary to set the initial project programming budget. After being programmed, the project budget growth is limited to 3% per year.
121.5.2.6 What Does the Asset Management Plan (AMP) Tell Me?
- The AMP is based on a 10-year window and it indicates if the district has any funds leftover after taking care of bridges and pavements in the AMP.
- If a district has any leftover funds, i.e. the district can meet their AMP goals, then system improvement projects can be programmed.
- If a district does not have any leftover funds i.e. the district cannot meet their AMP goals, then tradeoff discussions must take place within the district and planning partners. Priority will be given to the interstate and major routes (NHS) as the FAST Act emphasizes maintaining these routes.
For current conditions, costs to maintain the system, work types, life cycles etc., see Current Asset Management Plan Summary.
121.5.3 Lifecycle Planning & Preventive Maintenance
Ideally, every mile of pavement and every bridge in the state would be in good condition. Unfortunately, funding is not available to improve and maintain Missouri’s entire transportation system in good condition, so priorities must be established. Significant investments have been made to improve pavement and bridge conditions over the last decade.
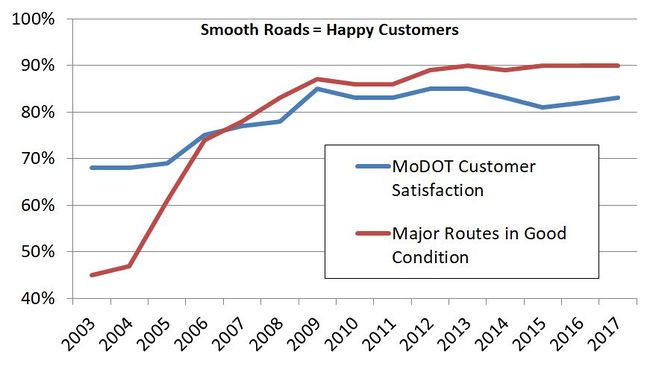
A previous significant investment known as The Smooth Roads Initiative (SRI) improved 2,200 miles of Missouri’s most heavily traveled roads. This program was completed in late 2006 and was mostly comprised of very thin resurfacing treatments to improve the smoothness of the pavement. Missouri’s Major Route system went from approximately 45 percent good pavements to 85 percent good pavements with this initiative and other strategic investments. The goal is to maintain these improved smooth surfaces. As you can see from the chart above, when road smoothness increases on major routes, so does customer satisfaction.
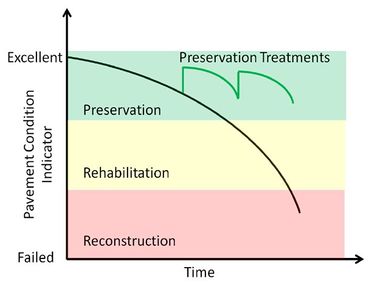
The underlying goal of MoDOT’s asset management plan is to maintain the current condition of pavements and bridges. The most cost effective method to preserve pavements and bridges is to use preventive maintenance treatments while the assets are still in good/fair condition. The chart below shows the basic strategy for MoDOT’s AMP – focused on less expensive preservation treatments more often than expensive rehabilitation and reconstruction treatments less often. The objective is to slow down the rate of deterioration and provide a smooth, durable and safe roadway for users at the lowest cost.
Lifecycle planning should not be confused with life cycle cost analysis (LCCA). LCCA is performed at the project level and compares specific treatment options against each other, for example, concrete vs. asphalt on a pavement project. Lifecycle planning is performed at the network level where the needs of all roads and structures within that particular network are considered.
121.5.3.1 Pavements
Keeping good roads in good condition is the basic premise of MoDOT’s AMP. The pavement treatment costs for this approach are slightly different for interstates vs. major routes vs. minor routes. Predicting the future costs to keep roadways in good condition involves estimating the type of treatment work needed for each roadway category, when those treatments will be needed and how long those treatments will be effective. The effective life of pavement is most commonly impacted by the traffic volume, preventive maintenance activities, ground support and quality of the materials used in the pavement. For example, interstate routes require a more expensive, heavy-duty pavement to withstand higher traffic volumes and truck traffic.
MoDOT’s approach to pavement preservation is applying a thin, preventive maintenance treatment on a routine cycle. This is the most cost effective way to keep the roads in good condition for the traveling public and preserve the investments made over the last decade. In rare instances, pavements will need a full depth replacement, but properly designed and maintained pavements should only require a preventive maintenance treatment to extend its full life. In addition to the cyclical preventive maintenance treatments, other preventive maintenance treatments such as crack sealing and pavement repairs are performed to further extend the pavements useful life.
For the treatment assumptions, treatment life and average cost for interstate and major routes see Current Asset Management Plan Summary.
121.5.3.2 Bridges
Since Missouri has a large number of poor condition bridges, a preventive maintenance approach alone will not be sufficient to maintain current conditions. A combination of a preventive maintenance approach to prolong the useful life of Missouri’s existing bridges and an aggressive bridge repair/replacement program is needed to maintain current bridge conditions.
121.5.3.2.1 Bridge Preventive Maintenance
MoDOT also performs preventive maintenance activities for bridges. These activities are crucial to providing the lowest lifecycle costs and include:
- Bridge cleaning and flushing to remove dirt and debris and to allow proper drainage and drying of the deck. The dirt and debris holds moisture and chlorides that cause deterioration. Deck flushing is done in the fall and spring with a thorough cleaning of entire bridge done in the spring following snow season and again in the fall prior to snow season. This cleaning includes the bridge deck, piers, abutments and lower chords of truss bridges. The goal is to flush all bridges each year.
- Bridge joint and deck sealing is done to prevent dirt, debris and chlorides from deteriorating the deck and supporting bridge members. Sealing activities are performed on a cyclic basis as well as condition basis.
- Spot painting of bearings and pilings is done to protect from rusting and is performed on an as-needed basis.
121.5.3.2.2 Typical Bridges (shorter than 1000 feet) – Bridge Work Type
MoDOT will do a combination of replacements, redecks, rehabilitation and preventive maintenance treatments to maintain current conditions. Bridge work varies in price per bridge and type of work being performed. For the treatment assumptions, treatment life and average cost for work types see Current Asset Management Plan Summary.
Historically, MoDOT has approached bridge work by the “worst first” method. Asset management has changed the focus from a “worst first” approach to a multi-focused approach including not only full replacements of poor bridges, but also on preventive maintenance of fair condition bridges. The preventive maintenance can be rehabilitation work or traditional type preventive maintenance such as flushing. The focus on preventive maintenance allows MoDOT to keep more bridges in a fair condition much longer.
121.5.3.2.3 Major Bridges (1000 feet or longer) – Bridge Work Type
A major bridge is greater than 1,000 feet in length. The concept of preventive maintenance to maintain current condition is also used on the major bridges in Missouri. Unfortunately, several of the major bridges in Missouri are also well over their useful life and are in need of a full costly replacement. MoDOT currently has over 200 major bridges with approximately 11 percent categorized as poor condition and are in need of replacement, and 63 percent are in the fair condition category.
121.5.4 Funding Assets
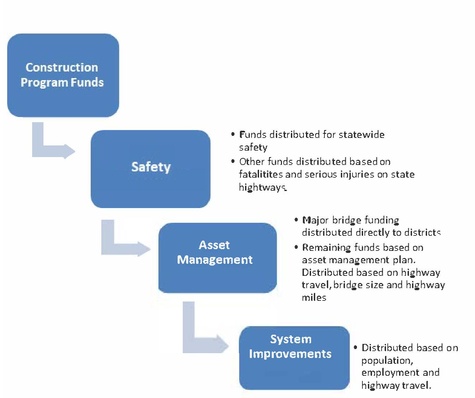
The Missouri Highways and Transportation Commission uses a formula to distribute construction program funds for road and bridge improvements to each of its districts. This is the largest area of MoDOT’s budget that provides funding for safety improvements, asset management and system improvement funds that districts can use to take care of the system or invest in major projects that improve safety, relieve congestion and spur economic growth.
 |
| Construction Program Funds Distribution |
Once construction program funds are distributed to districts, MoDOT collaborates with regional planning groups to identify local priorities based on projected available funding. The regional transportation improvement plans are brought together to form the department’s STIP, which outlines five years of transportation improvements. As one year of the plan is accomplished, another year is added.
Beginning in Fiscal Year 2022, the Asset Management category allocation amount is based on needs identified in MoDOT’s Asset Management Plan and will be reviewed and updated, if necessary, annually. These amounts will include inflation consistent with MoDOT’s Asset Management Plan. The allocation is distributed as follows:
- Major Bridges (1000 feet or longer)
- Asset Management – Remaining asset management total distributed based on formulas that average:
- • Percent of total Vehicles Miles Traveled (VMT) on the National Highway System and remaining arterials.
- • Percent of square feet of typical state bridge deck (shorter than 1000 feet) on the total state system.
- • Percent of total lane miles of National Highway System and remaining arterials.
Beginning in Fiscal Year 2022 and every year thereafter, the remaining funds, System Improvements, must be first used to meet asset management goals, and then remaining funds may be used for other priorities.
Distribution based on the average of:
- Percent of total population.
- Percent of total employment.
- Percent of total VMT on the National Highway System and remaining arterials.
| Additional Information about Bridge Costs |
| 10-Year Major Bridge Needs, 2021 |
Major Bridges are funded under the Asset Management funding category as shown above. Each year the Major Bridge asset management information found in the 10-year Major Bridge Needs will be reviewed and updated by MoDOT districts and Central Office Bridge Division. If the bridge work falls within the first 3 years of the 5-year STIP, the year and dollar amounts need to be very accurate. The scope of work for Major Bridges needs to be detailed showing all the work items beyond the bridge work such as: adding lanes, expanded shoulder width, lighting, ADA accommodations, aesthetics, etc. All items of work beyond the scope of the bridge itself require the approval of the Chief Engineer to use Major Bridge asset management funds. Roadway tie-ins and traffic control will be considered part of the cost of the bridge and funded from the asset management category, however significant roadway work is not considered part of the Major Bridge and will require the approval of the Chief Engineer to use Major Bridge asset management funds. Any overruns in the project budget for scope considered beyond the Major Bridge work must be funded by the district, all underruns in the project budget will be allocated by the established funding distribution with the exception of funds from other sources that may be allocated by a pro rata share with the approval of the Chief Engineer.
121.5.5 Asset Management Updates
The Asset Management Plan (AMP) is a 10-year rolling plan. Each year every MoDOT district will update the AMP assumptions including: pavement cost per mile, bridge cost per square foot, treatment type, treatment life, number of miles and/or bridges being treated to align with the most current data for the region. The Current Asset Management Plan Summary document is updated yearly to reflect the statewide overall totals and assumptions that are included in the AMP. Below is the rolling timeline associated with producing yearly updates to the AMP.
Central Office Transportation Planning Division houses numerous documents and information for the asset management plan and can be found on the Transportation Planning Division’s Sharepoint site. This information is important when preparing the district’s annual AMP update or to simply refer to in the program delivery process. The documents located on the Sharepoint site are (but not limited to): Instructions to districts for updating their yearly plan, contact information, AMP timeline, historic pavement and bridge data, and each district’s specific asset management plan.
